Abstract: At this stage, the world's energy consumption presents the following hot spots: 1) the world's primary energy consumption is increasing due to economic development and population growth; 2) the world's energy consumption shows different growth patterns, developed countries enter the post-industrial society, the economy To the development of low-energy, high-output industrial structure, the growth rate of energy consumption is significantly lower than that of developing countries; 3) the world energy consumption structure tends to be better, but the regional differences are still large; 4) the world's energy resources are still relatively rich, but Energy trade and transportation pressures have increased. In the future, with the continuous growth of energy consumption and the increasing concentration of energy resources, the competition for energy resources will become increasingly fierce and the way of competition will be more complicated. At the same time, the impact of fossil energy on environmental pollution and global climate will Increasingly serious. Faced with the above challenges, the world's energy supply and consumption will develop towards diversification, cleanliness, efficiency, globalization and marketization.
I. Current world oil and gas resources ratio
So far, the main position of fossil energy represented by coal, oil and natural gas in energy consumption is still unshakable, but its internal structure is constantly changing. Since the beginning of the 20th century, especially since the Second World War, oil and natural gas consumption has continued to increase, and oil has replaced coal as the most important source of energy. According to BP statistics, the proportion of oil in the world's primary energy consumption peaked in 1973 (accounting for 48.7%) and then decreased year by year. By 2015, oil accounted for 32.9%; the share of natural gas continued to increase, from 1965 15.8% rose to 23.9% in 2015, an increase of about 8 percentage points; coal accounted for a slight rebound after falling to the lowest point in 1999 (about 25%), and maintained a 30% share in recent years. Around; the proportion of nuclear energy began to decline after a brief rise, accounting for less than 4.5% in 2015; renewable energy consumption has been steadily increasing over the past few decades (mainly hydropower), accounting for The proportion increased from 5.6% in 1965 to 9.6% in 2015, an increase of 4 percentage points. This shows that oil is still the most important energy source so far. In addition, fossil energy has a long-term internal growth. Its share of the world's primary energy consumption has remained above 85%, and the proportion of nuclear energy and renewable energy is still small.
(I) Status and characteristics of world energy consumption
1. The world’s primary energy consumption is increasing due to economic development and population growth.
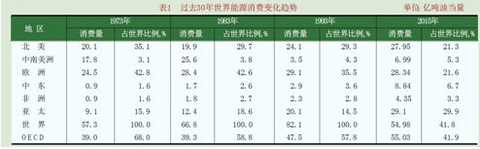
As the size of the world economy continues to increase, the world's energy consumption continues to grow. In 1990, the world’s gross domestic product was 26.5 trillion US dollars (calculated at constant prices in 1995). In 2000, it reached 34.3 trillion US dollars, with an average annual growth rate of 2.7%. According to the 2016 BP Energy Statistics, the world's primary energy consumption in 1973 was only 5.73 billion tons of oil equivalent. In 2003, it reached 9.74 billion tons of oil equivalent, and in 2015 it reached 13.276 billion barrels of oil equivalent. (See Table 1). Over the past 30 years, the world's energy consumption has grown at an average annual rate of around 1.8%.
|
2. The world's energy consumption presents different growth patterns, and the growth rate of developed countries is significantly lower than that of developing countries.
In the past 30 years, the total energy consumption in the six regions of North America, Central and South America, Europe, the Middle East, Africa and Asia Pacific has increased, but the growth rate of North America and Europe, where the economy, technology and society are relatively developed, is very high. Slowly, the proportion of its consumption to the world's total consumption has also decreased year by year. North America dropped from 35.1% in 1973 to 28.0% in 2015, and Europe fell from 42.8% in 1973 to 29.9% in 2015. The share of energy consumption in the OECD (OECD) member countries fell from 68.0% in 1973 to 55.4% in 2015. The main reason is that the economic development of developed countries has entered the post-industrialization stage, the economy has developed to a low-energy, high-output industrial structure, and the high-energy manufacturing industry has gradually turned to developing countries. Second, developed countries attach great importance to energy conservation and Improve energy efficiency.
3. The world's energy consumption structure tends to be better, but regional differences remain high.
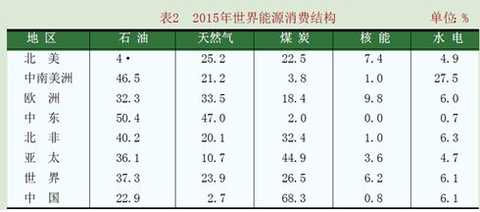
Since the industrial revolution of the 1970s, the consumption of fossil fuels has increased dramatically. In the early days, it was mainly based on coal. After the 20th century, especially since the Second World War, the production and consumption of oil and natural gas continued to rise. Oil surpassed coal for the first time in the 1960s and became the dominant position of primary energy. Although the world experienced two oil crises in the 1970s, there is no slight decline in world oil consumption. Since then, the proportion of oil and coal has slowly declined, and the proportion of natural gas has increased. At the same time, other forms of new energy such as nuclear energy, wind energy, hydropower and geothermal energy have been gradually developed and utilized, forming an energy structure that currently combines fossil fuels with renewable energy and new energy. By the end of 2015, fossil energy is still the world's main energy source, accounting for 87.7% of the world's primary energy supply, of which oil accounted for 37.3%, coal accounted for 26.5%, and natural gas accounted for 23.9%. Non-fossil energy and renewable energy, although growing rapidly, still maintain a low proportion of about 12.3% (see Table 2). As the Middle East has the most abundant oil and gas resources and the mining cost is extremely low, about 97% of the energy consumption in the Middle East is oil and natural gas, which is significantly higher than the world average, ranking first in the world. In the Asia-Pacific region, China, India and other countries are rich in coal resources, and coal accounts for a relatively high proportion of energy consumption structure. Among them, coal accounts for about 68% of China's energy structure. Therefore, in the energy structure of the Asia-Pacific region, oil The ratio to natural gas is low (about 47%), which is significantly lower than the world average. Except for the Asia-Pacific region, the proportion of oil and natural gas in other regions is higher than 60%.
|
4. The world's energy resources are still relatively rich, but energy trade and transportation pressures increase
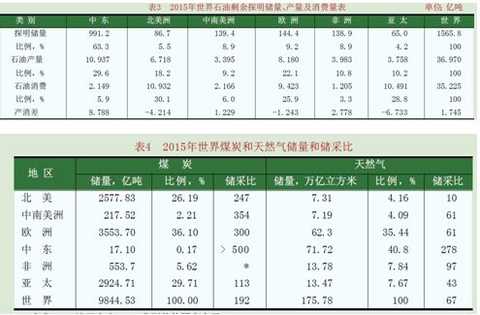
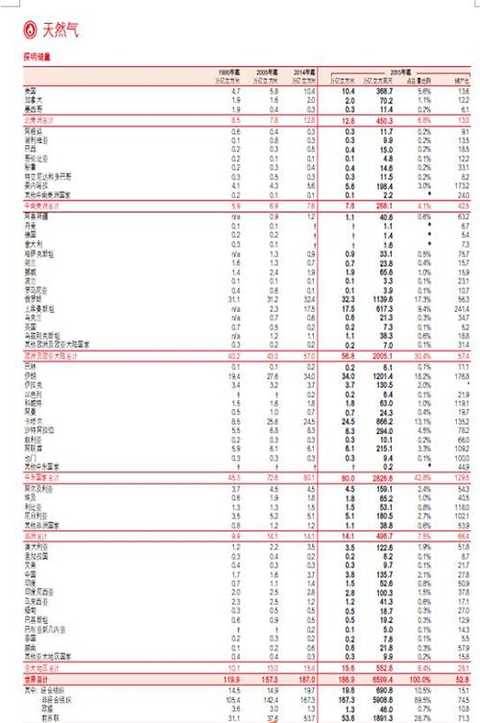
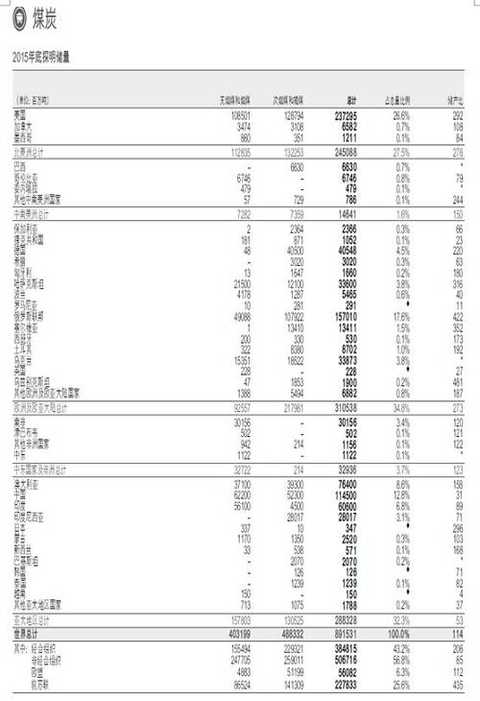
According to the 2016 BP World Energy Statistics, by the end of 2015, the world's remaining recoverable reserves of oil were 239 billion tons, of which the Middle East accounted for 63.3%, North America accounted for 5.5%, and Central and South America accounted for 8.9%. Europe accounted for 9.2%, Africa accounted for 8.9%, and Asia Pacific accounted for 4.2%. World oil production in 2015 was 3.697 billion tons, an increase of 3.8% over the previous year. By comparing the oil production and consumption in various regions (see Table 3), it can be found that the Middle East needs to export about 880 million tons, and the oil production in Africa and Central and South America is greater than the consumption, while the production gap in Asia Pacific, North America and Europe. They are 670 million, 420 million and 120 million tons respectively. There is also a huge imbalance in the distribution of coal resources. As of the end of 2015, the world's remaining reserves of coal are 984.45 billion tons, and the reserve-production ratio is as high as 192 (years). Europe, North America and Asia-Pacific are the world's major coal distribution areas, and the three regions together account for 92% of the world's total. % or so (see Table 4). In the same period, the remaining recoverable reserves of natural gas were 175.78 trillion cubic meters, and the reserve-production ratio reached 67. The Middle East and Europe are the regions with the richest natural gas resources in the world. The two regions account for 75.5% of the world's total, while the other regions share only 5% to 7%. With the relative depletion of energy resources in some parts of the world, the amount of energy trade between regions and countries in the world will further increase, and the demand for energy transportation will increase accordingly. Issues such as energy storage and transportation facilities and energy supply security will be increasingly valued.
|
(II) World energy supply and consumption trends
According to the latest forecast of the US Energy Information Administration (EIA), with the development of the world economy and society, the future world energy demand will continue to increase. In 2010, the world's energy demand reached 10.599 billion tons of oil equivalent. In 2020, it reached 12.889 billion tons of oil equivalent. In 2025, it reached 13.65 billion tons of oil equivalent, with an average annual growth rate of 1.2% (see Table 5). The proportion of energy consumption in the two developed regions of Europe and North America will continue to decline, while Asia, the Middle East, Central and South America will continue to grow. Along with the increasing concentration of the world's energy reserves, the competition for energy resources will become increasingly fierce, and the way of competition will be more complicated. The possibility of conflict or war caused by energy competition still exists.
As the world's energy consumption increases, the emission of environmental pollutants such as carbon dioxide, nitrogen oxides and dust particles increases year by year, and the impact of fossil energy on environmental pollution and global climate will become increasingly serious. According to EIA statistics, the world's carbon dioxide emissions in 1990 were about 21.56 billion tons, reaching 2.39 billion tons in 2001. It is expected to be 27.72 billion tons in 2010 and 37.12 billion tons in 2025, with an average annual growth rate of 1.85%. Faced with the above challenges, the future world energy supply and consumption will be diversified, clean, efficient, globalized and market-oriented.
|

Although the status of fossil energy as the dominant energy source will not change in the short term, the future energy structure will undergo significant changes due to factors such as global climate change and the development of new technologies. On the one hand, the proportion of fossil energy will continue to decline in the foreseeable future, while the proportion of renewable energy continues to rise. On the other hand, due to the development of new technologies, natural gas mining costs are getting lower and lower, and as a relatively clean, low-carbon fuel, natural gas will replace coal as the second largest fuel. Although there are some differences in the predictions of different institutions, as long as countries take certain measures to solve the problem of climate change, the trend of future energy structure changes is roughly the same. The proportion of fossil energy in primary energy consumption has dropped significantly, from the current 85% to about 75%. Among them, oil is expected to grow steadily at an average annual rate of 0.9%, but its share in primary energy is declining. However, oil is still the most important fuel; natural gas is expected to grow at an average annual rate of 1.8%. The fastest growing fossil energy will replace coal as the second largest fuel by 2030. In addition, the proportion of non-fossil energy is rising rapidly, especially renewable energy.
At the same time as the global energy structure changes gradually, the energy structure of various regions of the world has also changed. In the future, due to carbon emissions, the proportion of coal consumption in the Asia-Pacific region will be significantly reduced, while the proportion of natural gas and non-fossil energy will tend to rise. Taking China as an example, according to the China Energy Research Association, by 2030, the proportion of coal consumption has fallen sharply to 49%, down 15 percentage points from 2015; the proportion of oil consumption has fallen to 17%, with little decline; total clean energy (including natural gas and non-fossil energy) accounted for 34%, an increase of 16 percentage points over 2015. It can be seen that the optimization of China's primary energy consumption structure is consistent with the changing trend of the world energy consumption structure.
From 1990 to 2015, the world's primary energy consumption increased from 7 162.19 million tons of oil equivalent to 11 306.40 million tons of oil equivalent, an average annual increase of 1.84%, and experienced a process of rising first and then falling. In 2000-2010, rapid consumption growth occurred, with crude oil growing at an average annual rate of 1.27%, natural gas at 2.84%, and coal at 4.37%. Coal and natural gas consumption was significantly driven. In 2010-2015, there was a slow growth. The three annual growth rates were 1.20%, 1.57% and 1.11%, respectively, still due to the slowdown of coal. “High-High†region: including the Middle East, Mexico, Argentina, Brazil, Africa, Algeria and Egypt, Europe, Turkey, Asia Pacific, China, India, South Korea, Singapore, Indonesia, Thailand, etc. The above 22 countries accounted for 51.53% of the world's consumption, and the average annual growth rate reached 5.14%, much higher than the world level of 1.84%. “High-medium†region: including Venezuela, Colombia, South Africa, Australia, Spain, Portugal, Norway, etc., European countries account for more than half. “High-low†areas: including Canada, the United States, North Korea, and France, Germany, etc. In addition, there are 65 countries in the middle three districts and 69 countries in the low-value three districts. In general, the world's energy consumption is mainly distributed in Asia Pacific, Europe, North America and the Middle East. Consumption growth in the traditional energy-consuming countries such as the United States, Russia, Japan, Canada, France and Germany has been negative in recent years, and consumption growth in other European countries such as Portugal and Spain has also slowed down. European and American countries have shifted their energy structure to lower-carbon renewable energy, and it is remarkable that coal consumption has plummeted. Emerging economies such as China, India, Singapore, South Korea and Brazil are still driving the world's energy consumption.
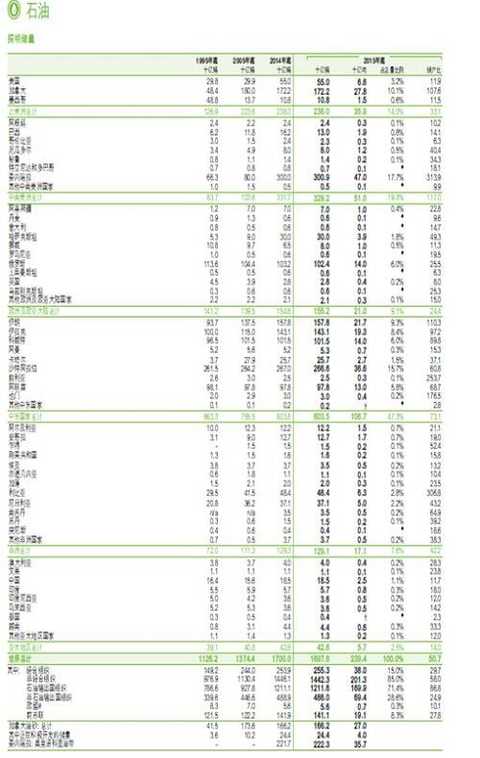
Second, the distribution of oil and gas resources in various regions
With the rise of unconventional oil and gas such as shale oil and shale gas, the energy supply is increasingly polarized and diversified. Benefiting from the shale gas revolution, the rich oil and gas resources of the Americas such as the United States, Canada, Brazil and Venezuela have been developed and utilized. According to BP statistics, in the 2015 remaining oil reserves, the Americas | (including North and South America) |) accounted for 33.4% of the world, accounting for 70.6% of the remaining proven reserves in the Middle East. The supply of oil (including crude oil, shale oil, liquefied natural gas, etc.) in the Americas increased from 21.0 million barrels per day in 2005 to 2015. The annual growth rate of 27.4 million barrels per day is 640,000 barrels per day. If the oil supply in the Americas continues to grow at an average annual rate of 2.7%, it will surpass the Middle East as the largest oil supplier in around 2025. It also benefits from breakthroughs in shale gas development technology. In 2009, the United States was 584 billion cubic meters. For the first time, rice production surpassed Russia to become the world's largest natural gas producer, and continued to grow at a rate of 4.7%. In 2015, the annual output has exceeded Russia's 200 cubic meters.
As the development of unconventional oil and gas matures and grows, the Americas region is expected to become the “second Middle Eastâ€. From the perspective of development speed, the United States is particularly eye-catching. The United States is likely to become a net exporter of oil by 2020, and according to BP's conservative forecast, the United States will also become a net exporter of oil in 2030. The above shows that the US “energy independence†strategy will become possible. In addition, it is worth mentioning that Canada. Canada may become a new energy superpower. According to IEA forecasts, Canada's oil production will reach 30 to 60 million barrels per day by 2030. Americas | The rise of energy in the highlands has further strengthened the multi-polarization trend of tourism and supply.
From the perspective of energy supply structure, due to the increasingly strict carbon emission policy and the rapid development of new energy technologies, natural gas supply has entered a golden age, and the status of renewable energy continues to rise, enabling supply to continue to be more efficient and clean. Direction development. The proportion of shale gas in total production increased from slightly more than 10% in 2014 to nearly 25'1 in 2035. The growth of almost all shale gas output in the next 10 years originated in the United States, and by 2035, China will It has become the country that contributes the most to the increase in shale gas production, with daily production reaching around 370 million cubic meters. The supply of natural gas has replaced the “centralized†by “distributedâ€, alleviating a major problem that restricts the development of natural gas. The long-distance transportation of natural gas will continue to increase its position in the future.
1. Oil reserves and distribution
|
|

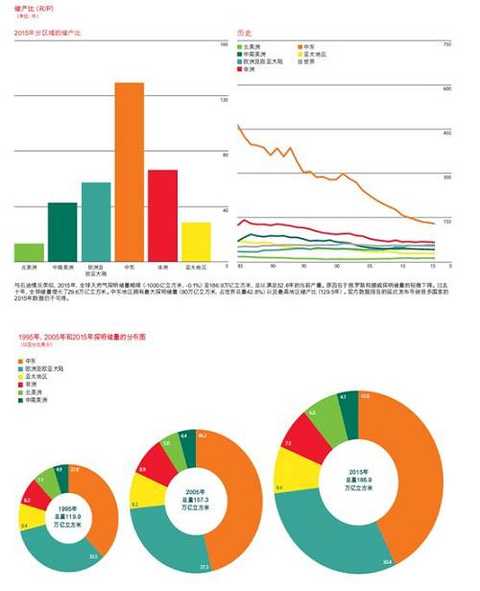
2. Natural gas reserves and distribution
|
|
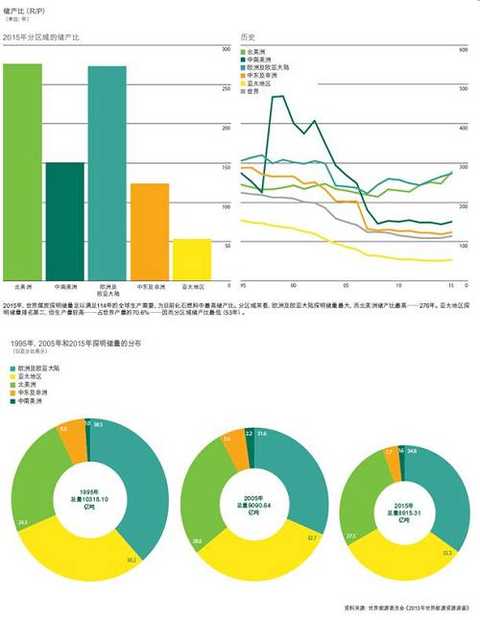
3. Coal reserves and distribution
|
|
|
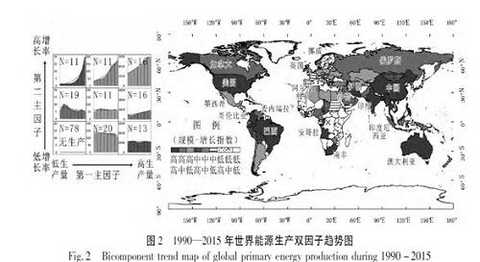
The world's energy production is mainly distributed in the Middle East, Asia-Pacific, the former Soviet Union, the Americas and Northwest Africa. It is broadly divided into the following categories: “High-High†area (high production, high growth rate), including the United States, Colombia, Brazil, Africa, Africa, Angola, Qatar in the Middle East, and Asia-Pacific China, India, Australia. In 15 countries, the proportion of energy production increased from 47.85% in 1990 to 60.96% in 2015. The “high-middle†region, including members of the Organization of Petroleum Exporting Countries (OPEC) in the Middle East, Russia, Canada, and Venezuela, continued to grow steadily. "High-low" areas, including Mexico, the United Kingdom, Germany, Libya, Syria, etc. The above 45 countries include more than 90% of world production. China, the United States, Russia, Saudi Arabia and Canada are among the top five energy producers in the world. The “middle-highâ€, “middle-middle†and “medium-low†categories of 42 countries have a small production volume, but Equatorial Guinea, Congo (Brazzaville) and Gabon are among the important energy suppliers in the region. The country's energy production is small.
|
|
|
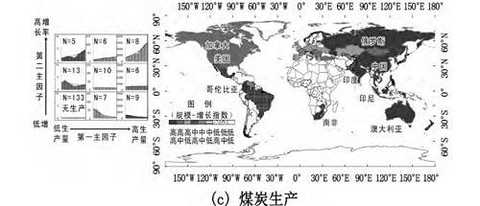
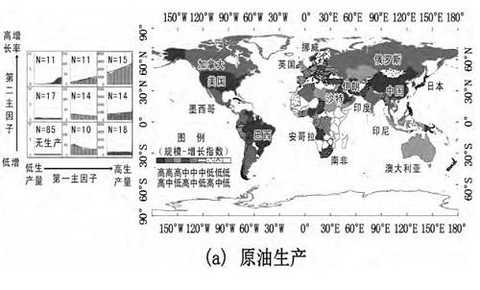
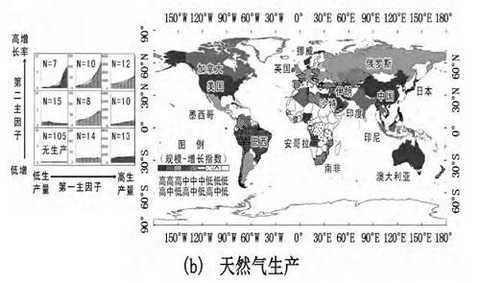
The spatial production patterns of crude oil, natural gas and coal are different. The crude oil production is mainly distributed in the Middle East (32.38%), North America (20. 87%), the former Soviet Union (15.5%), Asia-Pacific (9.4%), Central and South America (9.8%), Northwest Africa (8.83%), and almost 85 countries with no crude oil production. Natural gas production is mainly distributed in North America (28.14%), the former Soviet Union (21.15%), the Middle East (17.38%), and Asia Pacific (15.75%). Among them, the United States, Russia, Iran, Qatar, and Canada are among the top five natural gas producers in the world, and there are about 105 countries with almost no natural gas production. The spatial distribution of coal production is relatively more compact, concentrated in the Asia-Pacific, the former Soviet Union and North America. High-yield and high-growth countries include China, India, Australia, Indonesia, South Africa and Vietnam, with almost 133 coal-free countries.
Third, the future direction of development
Under the forecast basic scenario, the future world economy will grow at a rate of 3.2%. The regions with faster growth are non-OECD countries such as Asia Pacific, Middle East and Africa. The economic growth rate is expected to reach 5.2%, 3.7% and 3.6% respectively. The fastest growing countries are China and India, with economic growth rates expected to reach 5.8% and 5.0%, respectively. With the growth of the world economy, the world's energy demand will increase steadily, with an average annual growth rate of 1.4%. In 2030, the world's primary energy demand will reach 17.163 billion tons of oil equivalent, and in 2035 it will reach 18.468 billion tons of oil equivalent (Figure 1). The energy demand of OECD countries is growing at an average annual rate of 2.2%, and the national energy demand of the organization is growing at an average annual rate of 0.5%. It is expected that the energy demand of OECD countries will increase from the current 6.143 billion tons of oil equivalent to 6.355 billion tons of oil equivalent in 2020 and 6.785 billion tons of oil equivalent in 2030 (Figure 2) and 7.018 billion tons of oil equivalent in 2035; The proportion of primary energy demand in the world will fall from the current 49.6% to 43.0% in 2020 and 39.5% in 2030, and 38.0% in 2035. Energy demand in non-OECD countries will increase from the current 6.238 billion tons of oil equivalent to 8.408 billion tons equivalent in 2020.
|
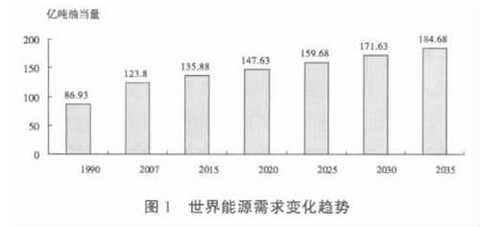
Figure 1
|
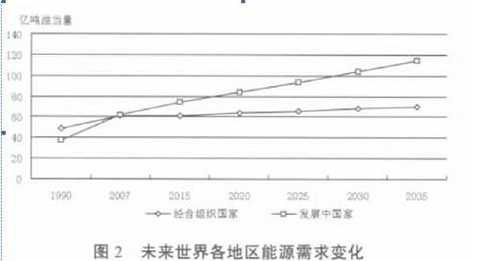
Figure II
1. Coal demand is growing steadily
Under the basic scenario, the average annual growth rate of coal consumption is 1.6%, from 5.508 billion tons in 2007 to 7.721 billion tons in 2030 and 8.582 billion tons in 2035. The proportion of coal in the world's primary energy consumption structure will increase, from 26.7% in 2007 to 27.0% in 2030 and 27.9% in 2035. Non-OECD countries are still the world's major consumers of coal, with an average annual growth rate of 2.3%, from 3.519 billion tons in 2007 to 5.791 billion tons in 2030 and 6.569 billion tons in 2035. The OECD countries will grow slightly, increasing from 1.993 billion tons in 2007 to 2.009 billion tons in 2035. China is the world's largest coal consumer and is expected to grow at an average annual rate of 6%, from 2.28 billion tons in 2007 to 4.181 billion tons in 2030, and 4.676 billion tons in 2035. The United States is the second largest coal consumer, with an average annual growth rate of 0.4%, which will increase from 944 million tons in 2007 to 1.011 billion tons in 2030, and will reach 1.044 billion tons in 2035. India is expected to grow at an average annual rate of 1.5%, from 424 million tons in 2007 to 570 million tons in 2030 and 645 million tons in 2035.
2. Oil is still the main energy source in the future
Oil remains the world's main source of energy. With the growth of the world economy, the basic scenario predicts that the future world oil demand will grow at an average annual rate of 0.9%, reaching 103.9 million barrels per day in 2030, an increase of 1780 barrels per day from the 86.1 million barrels per day in 2007. In 2035, it will reach 110.6 million barrels per day, an increase of 2,450 barrels per day from 2007, an increase of 28.5%.
Non-OECD countries in Asia Pacific, Central and South America and Africa have seen strong growth in oil demand. Oil demand in Asia-Pacific developing countries is growing at an average annual rate of 2.4%. It is expected that oil demand in 2030 and 2035 will reach 29.1 million barrels per day and 32.3 million barrels per day, respectively, an increase of 73.2% from the 16.8 million barrels per day in 2007 and 90.3%, of which India and China have the fastest growth in oil demand, with an average annual growth rate of 2.9% and 1.8%. The Middle East has an average annual growth rate of 1.9%. Oil demand in 2030 and 2035 will reach 9.5 million barrels per day and 11 million barrels per day, respectively, up 48.4% and 71.9% from 6.4 million barrels per day in 2007. African countries are growing at an average annual rate of 1.4%. Oil demand in 2030 and 2035 will reach 4.2 million barrels per day and 4.6 million barrels per day, respectively, up 35.5% and 48.4% from 3.1 million barrels per day in 2007. Oil demand in Central and South America is growing at an average annual rate of 1.0%. It is expected that oil demand in 2030 and 2035 will reach 7.5 million barrels per day and 8 million barrels per day, respectively, up 25.0% and 33.3% from 6 million barrels per day in 2007. . Oil demand in Eastern Europe and the former Soviet Union has increased slightly, with an average annual growth rate of 0.2%. Oil demand is expected to reach 5.1 million barrels per day and 5.4 million barrels per day in 2030 and 2035, respectively. Oil demand in the OECD countries has increased slightly. It is expected that oil demand in 2030 and 203 will reach 48.3 million barrels per day and 49.5 million barrels per day, respectively, down 2.5% and 1% from the current 48.8 million barrels per day.
3 , natural gas demand is steadily increasing
Under the forecast basic scenario, the annual average consumption growth rate of natural gas in the world will reach 1.3%, and the world natural gas consumption in 2030 and 2035 will reach 4.26 trillion cubic meters and 4.43 trillion cubic meters respectively. The Asia-Pacific region and the African region are expected to be the regions with the fastest growth in natural gas consumption. The average annual growth rate of natural gas consumption will be 3.5% and 2.9%, respectively, followed by 2.4% in the Middle East and 2.3% in Central and South America. China and Brazil will be the fastest growing countries for natural gas consumption, with 5.0% and 4.3% respectively, followed by India with 4.1%. With the opening of the natural gas market in Europe, its natural gas demand will grow rapidly, with an average annual increase of 0.5%. High economic growth will stimulate the demand for natural gas in the world. World natural gas production will continue to grow and is expected to reach 3.89 trillion cubic meters in 2020, 4.28 trillion cubic meters in 2030, and 4.40 trillion cubic meters in 2035.
Summary: Overall, the North American “shale gas revolutionâ€, rapid economic development in emerging market countries, global climate change and breakthroughs in new energy development have led to significant changes in the world energy landscape. These changes can be summarized as the following five points: despite the current weak energy demand, fast-growing emerging market countries will drive energy demand to continue to grow; in the future, natural gas will replace coal as the second largest fuel, and the proportion of renewable energy will rise rapidly; The rise of unconventional oil and gas such as rock oil and shale gas has made the energy supply more polarized and diversified. The focus of energy trade has shifted from the Atlantic 600558 to the Asia-Pacific region.
Written by: Yu Zhongyong, Fan Weiguo
(Editor: Wu Xiaolin HF106)
[Disclaimer] This article only represents the views of the cooperating contributors and does not represent the position of Hexun.com. Investors should act accordingly, at their own risk.
The classification of all the leather used to make bags is right here
Bag Leather,Luggage Leather,Glitter Synthetic Leather,Glitter Pu Artificial Leather
WENZHOU JOVAN INTERNATIONAL COMMERCIAL , https://www.wzjovan.com